CORROSION RESEARCH CENTER
High Resolution Techniques
Related
Images

|
CORROSION RESEARCH CENTER
|
|
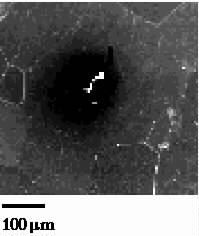
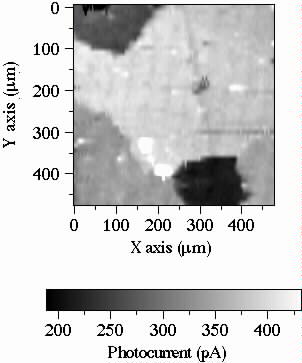
FIGURE 1b
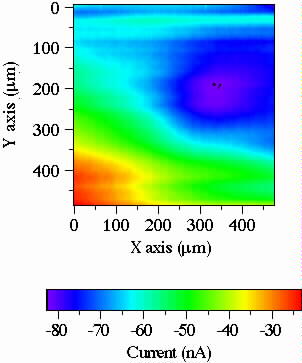
FIGURE 1c
FIGURE 1. SEM, PEM, and SECM of
the same
area in
a large grain Ti sample containing an inclusion (Al-Si particle). Notice the inclusions
appearing as a dark area inside the grain shown in the PEM image (1b) and then shown as a
region of high electrochemical activity in the SECM test (1c). The PEM image was done in
a 0.05 M H2SO4 solution, the Ti electrode was polarized at
+1.5 VSCE (the total current measured in the Ti electrode was 48 nA). The
SECM image was obtained by using a 0.1 M K4Fe(CN)6
solution, the Ti electrode was biased at 1 VSCE (the total current measured in
the Ti electrode was 8 ÁA), whereas the Gold part of the microelectrode was biased
to 0 VSCE (the background current measured in the microelectrode in this
solution prior to biasing the Ti electrode was 120 pA).
SECM (no feed-back)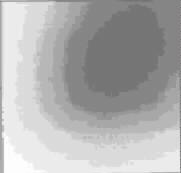

FIGURE 2a
Topography (with feed-back)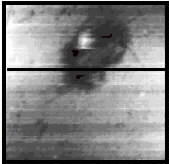
FIGURE 2b
SECM (with feed-back)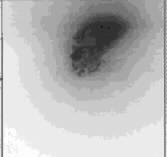
FIGURE 2c
FIGURE 2. SECM and Topography (squares of 35 Ám by side) for a Pt microelectrode imbedded in glass. The sample and the microelectrode probe were immersed in 0.1 M K4Fe(CN)6 solution. The SECM without feedback was obtained at an approximate distance between the sample and the probe Z ┼ 4 Ám. The SECM image obtained simultaneously with the shear-force topography (in liquid) was obtained by moving the probe at about z < 50 nm.
No Feedback PEM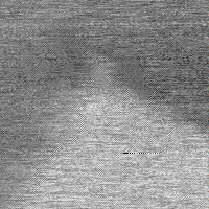
FIGURE 3b
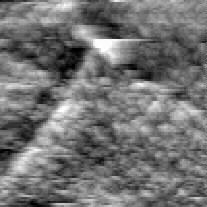
Topography Liquid (PEM)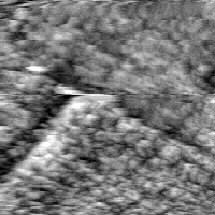
FIGURE 3c
PEM with Feedback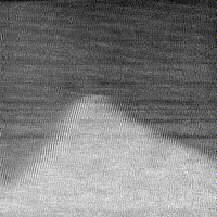
FIGURE 3d
FIGURE 3. PEM and topography (squares of 30 Ám by side) for polycrystalline titanium. The sample and the optical fiber ultra-microelectrode were immersed in 0.05 M H2SO4 solution. The PEM image obtained simultaneously with the shear-force topography (in liquid) was obtained by moving the probe at about Z < 50 nm.
CRC AREAS OF RESEARCH